.png)
The Report Builder feature is one of the key functions of Totara Learn, it is often the reason why it is preferred over other Learning Management Systems on the market. In today’s working world, it is essential for managers and leaders to have an insight into the LMS their company is using and be able to see how learners within their organisations are progressing and what are the completion rates.
Totara Learn has an inbuilt report builder, so without prior programming knowledge, learners will be able to see inside the database of the system and extract the reports that are meaningful to them. Totara Learn report builder has a large range of embedded default reports and reports sources (over 70!) that can be used to report on the various functions and activities within the LMS. Report Builder is where all the data in the system comes together. Embedded reports can be cloned and customised or custom reports can be created from scratch using available data sources and the process is both flexible and intuitive. Below are the key features of the report builder that we find most useful:
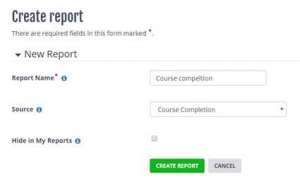
Creating a report:
Click on ‘Create report’ in the report builder, pick the source and configure it to you and your organisation’s needs:
Insights into learner progression and learning effectiveness
If the data is available, chances are, you will be able to find a report source for it. Examples of areas that can be reported are:
Course completions – used for reporting on course completions at a site level and can be made available to managers, heads of departments or trainers.
Most used columns are: learner name, course completion date, grade, grade to pass, completion status etc.
Program and Certifications – presents information on program and certification completions. This report can be linked to users’ dashboard and show training that is due to be completed. It is typically used to indicate completion for compliance courses. The most used columns are the following: completion date, completion status, due dates, assignment dates, expiry.
Competency Status – this report is used to report on the competencies that the learners have achieved. Most used columns – type, proficiency status, date proficiency achieved etc.
Record of Learning – Evidence – evidence area allows learners to provide evidence of training that happens outside LMS and upload certificates. Most used columns – type, institution, date completed, link to the attachment, etc.
Seminar Sessions – presents data on all seminar (face-to-face) events that were scheduled for learners throughout the system. Most used columns – places available, number of attendees, number of canceled bookings, reasons for cancellation, event status, etc.
The data that you are using in user profiles, course or certification fields can be used as columns in reports.
Dashboards:
By simply adding a report table the reports can be configured to appear on the dashboard for learners, instructors, so that different stakeholders can view the information that is essential for them as soon as the login to the system.
Report exporting and scheduling
As the report data is exportable (formats – csv, .xls and .pdf.) users with permission have the opportunity to see the reports and will be able to further work with data that is captured e.g. insert pivot tables and create graphs!
The reports can also be sent to users weekly, monthly or even daily if required. This feature helps to make the information easily accessible at the time that you need it.
Reporting Controls:
Site administrators can:
- Choose the columns that will appear in the report, and customise the titles
- Choose filters
- Decide how the data will be displayed – column, line, horizontal bar, pie, area and many more graph types are available
- Grant permission to view reports for users with particular roles – you can make the reports available to team managers, heads of the business unit, regional managers of country managers and make sure that the right and relevant information is available to the right people at the right time!
The reporting possibilities are endless, now you just have to decide who needs to see what and how to make it available to your stakeholders in the most meaningful way!